![]()
Machine Learning with Python for Algorithmic Trading
About Me
![]()

We are quite busy these days:
- Python for Finance University Certificate http://training.tpq.io
- For Python Quants Conference http://fpq.io
- Python for Quant Finance Meetup Group http://pqf.tpq.io
- Quant Platform http://pqp.io
- Financial Analytics Library http://dx-analytics.com
Trading Styles and Philosophies
Traditionally, there have been two three major groups of traders/investors:
- fundamental investors that analyze companies, their products, strategic position and financials in detail
- technical investors that have a look at "charts" and analyze stock price movements
- passive investors that do no analysis at all and invest in diversified portfolios
Recently, a new type of trader/investor has risen to prominence.
Algorithmic traders make us of, among others:
- mathematical, financial and data analytics algorithms
- dedicated hardware approaches, like cloud, co-location, FPGAs, etc.
- high performance approaches to trade in millisecond ranges
Within this group, different sub-types are distinguished, like HFT, market making, etc.
The holy grail of trading/investing is to predict in what direction the market will move over a horizon of
- five years
- one year
- one month
- one day
- one second
- ...
[The holy grail of gambling might be to predict whether red or black turns out at roulette.]
The big question is, are markets predictable after all?
For example, the efficient market hypothesis says that market prices "always reflect all available information", implying, for instance, that technical analysis (the study of charts) is pointless.
Another question is:
Can Machine Learning help with this problem?
Or does it maybe contribute to problems?
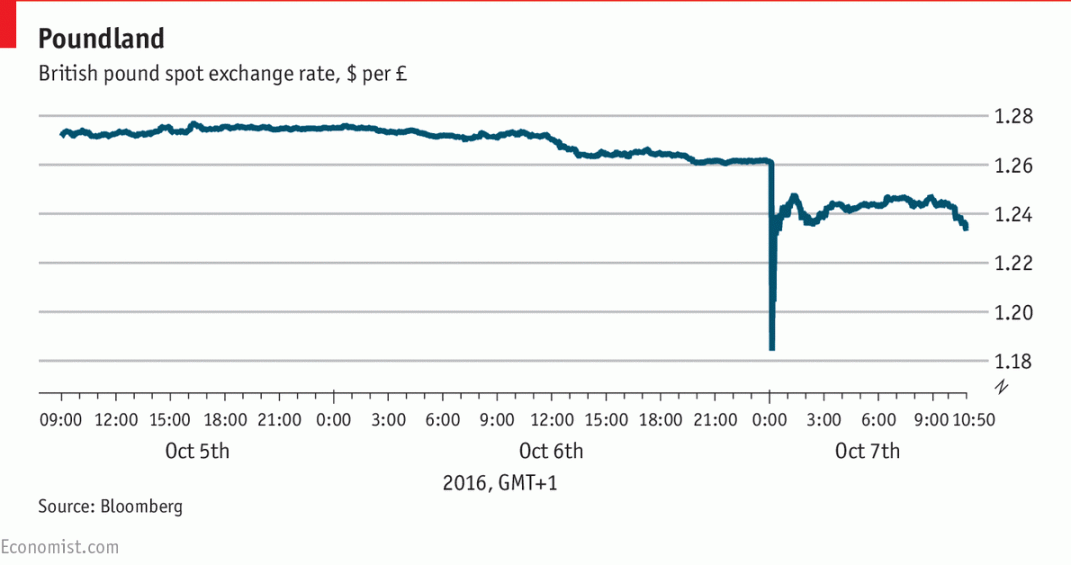
Economist, 07. October 2016: "Serling takes a pounding."
The best explanation seems to lie in the world of algorithmic trading—the computer programmes that automatically generate transactions. Such programmes have been blamed for “flash crashes” in the equity markets, particularly the May 2010 event which saw the Dow plunge nearly 1000 points in minutes before recovering.
Prediction with Machine Learning
Let us use machine learning to "predict" a deterministic series of numbers.
import numpy as np
from sklearn import linear_model
lm = linear_model.LinearRegression()
Our example data set.
a = np.arange(10)
a
We generate a matrix to apply linear regression to the prediction problem.
lags = 2
m = np.zeros((lags + 1, len(a) - lags))
for i in range(lags + 1):
    if i == lags:
        m[i] = a[i:]
    else:
        m[i] = a[i:i - lags]
The resulting vectors for the "independent & dependent" variables.
m.T
The fitting step.
lm.fit(m[:lags].T, m[lags])
The results.
lm.coef_
lm.intercept_
The prediction step (1).
np.dot(m[:lags].T, lm.coef_) + lm.intercept_
The prediction step (2).
lm.predict(m[:lags].T)
Stock Market Prediction as a Classification Problem
Stock market prediction is a classification problem in that one is only/mainly interested in the direction of the market movement, not the size of the movement.
The question is: Will the market go up or down?
[Is it red or black at roulette?]
Let us retrieve market data for the S&P 500 index.
import pandas as pd
from pandas_datareader import data as web
data = web.DataReader('^GSPC', data_source='yahoo')['Adj Close']
data = pd.DataFrame(data)
data.columns = ['SPX']
The data visualized.
import seaborn as sns; sns.set()
%matplotlib inline
data.plot(figsize=(10, 6));

Calculating the log returns.
data['returns'] = np.log(data / data.shift(1))
data.returns.hist(bins=35, figsize=(9, 5));

We are only interested in the sign of the return ("up or down").
data.returns.apply(np.sign).hist(bins=35, figsize=(9, 5));

Logistic Regression for Classification
In what follows, we use Logistic Regression to attack the classification/prediction problem. Cf. https://de.wikipedia.org/wiki/Logistische_Regression:
In statistics, logistic regression, or logit regression, or logit model is a regression model where the dependent variable (DV) is categorical.
Consider the following data set (cf. https://de.wikipedia.org/wiki/Logistische_Regression).
# hours of study for exam
hours = np.array([0.5, 0.75, 1., 1.25, 1.5, 1.75, 1.75, 2., 2.25, 2.5,
        2.75, 3., 3.25, 3.5, 4., 4.25, 4.5, 4.75, 5., 5.5])
# sucess given the hours of study
success = np.array([0, 0, 0, 0, 0, 0, 1, 0, 1, 0, 1, 0, 1, 0, 1, 1, 1, 1, 1, 1])
import matplotlib.pyplot as plt
plt.plot(hours, success, 'ro')
plt.ylim(-0.2, 1.2);

Applying Logistic Regression to the data set.
lm = linear_model.LogisticRegression()
lm.fit(hours.reshape(1, -1).T, success)
The results.
pred = lm.predict(hours.reshape(1, -1).T)
plt.plot(hours, success, 'ro', label='data set')
plt.plot(hours, pred, 'b^', label='prediction')
plt.ylim(-0.2, 1.2); plt.legend(loc=0);

Live Coding Example with Stock Market Data
![]()
http://tpq.io | @dyjh | team@tpq.io
Python for Finance Online Training | http://training.tpq.io
Python for Finance | Python for Finance @ O'Reilly
Derivatives Analytics with Python | Derivatives Analytics @ Wiley Finance
Listed Volatility and Variance Derivatives | Listed VV Derivatives @ Wiley Finance